Pin学习参考手册
Pin学习参考手册
使用的Pin版本:3.20
1. 简介
Pin 是一个动态二进制插桩工具,支持 Linux*, macOS* 和 Windows* 操作系统以及可执行程序。Pin可以通过pintools在程序运行期间动态地向可执行文件的任意位置插入任意代码(C/C++),也可以attach到一个正在运行的进程。
Pin 提供了丰富的 API,可以抽象出底层指令集特性,并允许将进程的寄存器数据等的上下文信息作为参数传递给注入的代码。Pin会自动存储和重置被注入代码覆盖的寄存器,以恢复程序的继续运行。对符号和调试信息也可以设置访问权限。
Pin内置了大量的样例插桩工具的源码,包括基本块分析其、缓存模拟器、指令跟踪生成器等,根据自己的实际需求进行自定义开发也十分方便。
2. 使用Pin进行插桩
1. Pin
对 Pin 的一个最合适的理解是可以将 Pin 当作一个 JIT 编译器,只是它的输入不是字节码,而是可执行文件。Pin 会拦截可执行文件的第一条指令,然后对从该指令开始的后续的指令序列重新“compile”新的代码,然后控制权限转移到新生成的代码。生成的代码与原始代码几乎一致,但是 Pin 会保证在分支退出代码序列时重新获得控制权限。重新获得控制权后,Pin 会基于分支生成更多的代码,然后继续运行。Pin 将所有生成的代码都保存在内存中,这样可以实现代码重用。
在这种 JIT 模式下,执行的是生成的代码,原始代码仅作为参考。当生成代码时,Pin 会给到用户注入自己想执行的代码(插桩)的机会。
Pin 对所有实际执行的代码进行插桩,不管代码具体处于哪个 section 。虽然对于一些条件分支会存在异常,但是如果指令没有被执行过,就一定不会被插桩。
Pin的完整架构如下:
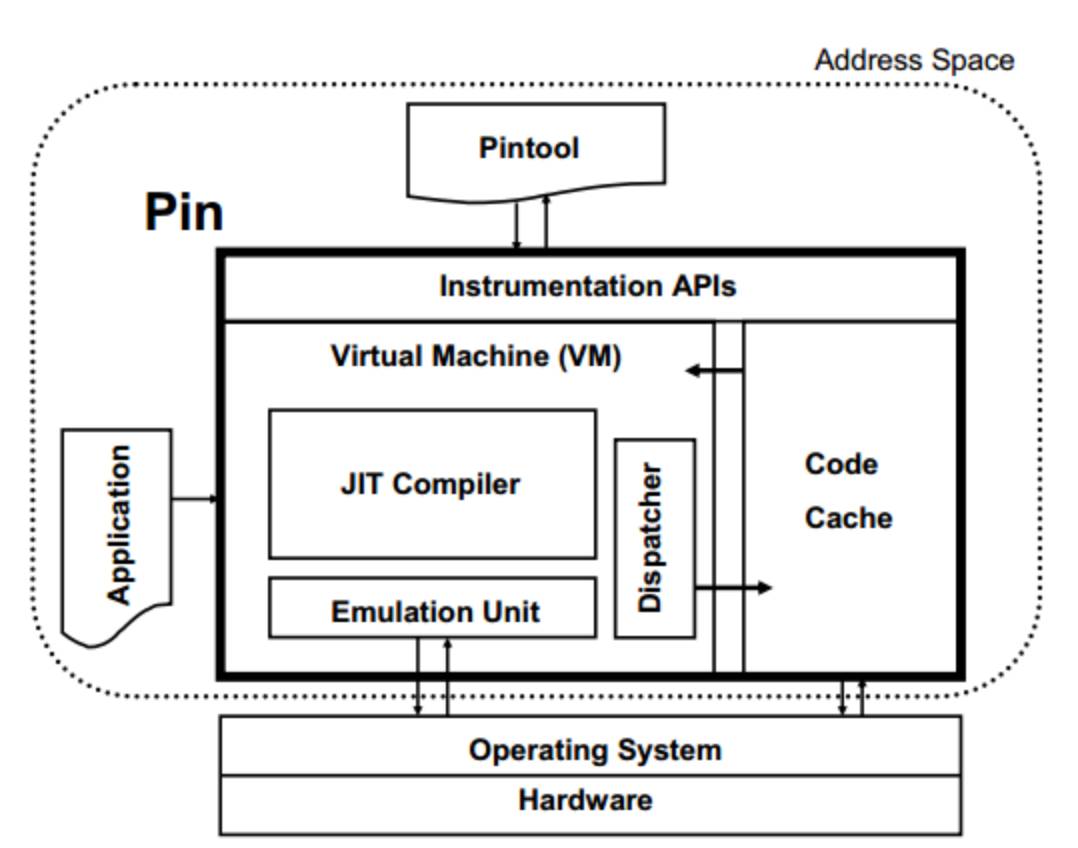
Pin工作在操作系统之上,所以只能捕获用户级别的指令。在一个经过插桩的程序运行时,同时有3个程序运行:应用程序本身、Pin、Pintool。Pin是对应用程序进行插桩的引擎,Pintool中包含了插桩的指令,可以看作是Pin的一个library。三者共享同一个地址空间,但不共享库,避免了冲突。
2. Pintools
在概念上,插桩主要包含两部分内容:
插桩机制(instrumentation code)
在什么位置插入什么样的代码
分析代码(analysis code)
在插桩点执行的代码
这两部分内容都通过 Pintool 这个可执行文件来实现。Pintool 可以看作是 Pin 中可以实现修改代码生成过程的插件。
Pintool 会向 Pin 注册插桩回调例程,每当需要生成新代码时, Pin 会调用这些回调例程。回调例程承担了检测插桩内容的作用,它会检查要生成的代码,检查其静态属性,并决定是否以及在何处注入对分析函数的调用。
分析功能收集有关应用程序的数据。Pin 确保根据需要保存和恢复整数和浮点寄存器状态,并允许将参数传递给函数。
Pintool 还可以为诸如线程创建或 fork 之类的事件注册通知回调例程,这些回调通常用于收集数据或工具初始化和清理。
因为 Pintool 采用的是类似插件的工作机制,所以必须运行在和 Pin 及插桩的可执行文件相同的地址空间内,所以 Pintool 可以访问可执行文件的全部数据,还会与可执行文件共享 fd 和其他进程信息。
在 Pintool 的开发过程中,分析代码的调优比插桩代码更重要,因为插桩代码只执行一次,但是分析代码会调用很多次。
3. 插桩粒度
1. trace instrumentation
在一个代码序列第一次执行前进行插桩,这种粒度的插桩称为“trace instrumentation”。在这种模式下,Pintool 一次“trace”执行一次检查和插桩,“trace”是指从一个 branch 开始,以一个无条件跳转 branch 结束,包含 call 和 return。
Pin 会保证每个 trace 只有一个顶部入口,但是可能包含多个出口。如果一个分支连接到了一个 trace 的中间位置,Pin 会生成一个以该分支作为开始的新的 trace 。Pin 将 trace 切分成了基本块,每个基本块称为“BBL”,每个 BBL 是一个单一入口、单一出口的指令序列。如果有分支连接到了 BBL 的中间位置,会定义一个新的 BBL 。通常以 BBL 为单位插入分析调用,而不是对每个指令都插入,这样可以降低分析调用的性能消耗。trace instrumentation 通过 TRACE_AddInstrumentFunction API 调用。
因为 Pin 是在程序执行时动态发现程序的执行流,所以 BBL 的概念与传统的基本块的概念有所不同,说明如下:
1 2 3 4 5 6 7 8 | swtich(i){ case 4: total++; case 3: total++; case 2: total++; case 1: total++; case 0: default: break;} |
在 IA-32 架构下,会生成如下类似的指令:
1 2 3 4 5 6 7 8 | .L7: addl $1, -4(%ebp).L6: addl $1, -4(%ebp).L5: addl $1, -4(%ebp).L4: addl $1, -4(%ebp) |
传统基本块的计算方式是会把每个 addl 指令作为一个单独的指令基本块,但是对于 Pin 来说,随着执行不同的 switch cases,Pin 会在 .L7 作为入口(从 .L7 依次向下执行)的时候生成包含所有4个指令的 BBL,在 .L6 输入的时候生成包含3个指令的 BBL,依此类推。所以,在 Pin 的统计方式里,如果代码分支走到了 .L7 ,只会计算一个 Pin BBL,但是4个传统概念上的基本块都被执行了。
Pin 在遇到一些特殊指令的时候会直接作为 trace 的结束位置,生成一个 BBL, 比如 cpuid, popf 以及 REP 为前缀的指令。REP 为前缀的指令都被当作隐式循环处理,在处理完第一次的迭代后,后面的每次迭代都作为一个单独的 BBL ,因此这种情况下,会看到比传统基本块统计方式统计出更多的 BBL。
2. instruction instrumentation
Pintool 会在可执行文件的每条指令都进行插桩,这种模式使得开发者不必过多关注 trace 内部的迭代循环指令,因为如上面所说,包含循环的 trace 内部的特定的 BBL 和指令可能产生多次。instruction instrumentation 通过 INS_AddInstrumentFunction API 进行调用。
3. image instrumentation
通过“caching”插桩请求实现,会有额外的内存空间要求,属于一种“提前插桩”。image instrumentation 模式下,Pintool 在 IMG:Image Object第一次加载时,对整个 imgaes 进行检查和插桩, Pintool 可以遍历 image 的 sections:SEC:Section Object, 可以是 section 中的 routine:RTN:Routine,还可以是一个 routine 中的 instructions:INS。插入位置可以是例程或指令的前面或后面,都可以实现,使用的 API 为 IMG_AddInstrumentFunction 。
image instrumentation 需要有调试信息来确定 routine 的边界,所以在调用 PIN_Init 之前,需要先初始化符号信息 PIN_InitSysmbols。
4. routine instrumentation
通过“caching”插桩请求实现,会有额外的内存空间要求,属于一种“提前插桩”。routine instrumentation 模式下,Pintool 在 image 首次加载时就对整个 routine 进行检查和插桩,对 routine 中的每条指令都可以插桩,但是没有充分的信息可以将指令划分为 BBL。插入位置可以是执行例程或指令的前后。这种模式其实更大程度上属于 image instrumentation 的替代方法,使用的 API 为 RTN_AddInstrumentFunction。
需要注意的是,在 image 和 routine instrumentation 模式下,插桩时并不确定 routine 是否会被执行,但是通过识别 routine 的开始指令,可以遍历出执行过的 routine 的指令。
4. 符号
Pin 通过symbol object 来访问函数名, 但是 symbol 对象只能提供程序中的函数符号相关的信息,对于数据符号之类的信息必须通过其他工具获取。
Windows下,可以通过 dbghelp.dll 文件获取,但是可能出现死锁问题;Linux下可以通过 libelf.so 或 libdwarf.so 文件获取符号信息。
3. 官方样例
本章主要是通过运行一些 Pin 内置的样例 Pintool,来实际感受一下 Pin 的插桩过程。实践出真知。
1. 构建样例工具
ia32 架构的样例:
1 2 | $ cd source/tools/ManualExamples$ make all TARGET=ia32 |
ia64 架构的样例:
1 2 | $ cd source/tools/ManualExamples$ make all TARGET=intel64 |
编译并运行某个样例:
1 2 | $ cd source/tools/ManualExamples$ make inscount0.test TARGET=intel64 |
编译某个样例但不运行:
1 2 3 | $ cd source/tools/ManualExamples$ make obj-intel64/inscount0.so TARGET=intel64# $ make obj-ia32/inscount0.so TARGET=ia32 |
2. 简单的指令计数(指令插桩)
功能:统计执行过的指令的总数。
运行和查看输出:
1 2 3 4 5 6 7 8 | $ ../../../pin -t obj-intel64/inscount0.so -o inscount.out -- /bin/lsMakefile atrace.o imageload.out itrace proccountMakefile.example imageload inscount0 itrace.o proccount.oatrace imageload.o inscount0.o itrace.out$ cat inscount.outCount 422838# 输出文件存在默认名称,可以使用-o参数指定输出文件名。 |
原理:在每个指令前插入对 docount 的调用,并将结果保存在 inscount.out 文件中。
源码 source/tools/ManualExamples/inscount0.cpp:
1 2 3 4 5 6 7 8 9 10 11 12 13 14 15 16 17 18 19 20 21 22 23 24 25 26 27 28 29 30 31 32 33 34 35 36 37 38 39 40 41 42 43 44 45 46 47 48 49 50 51 52 53 54 55 56 57 58 59 60 61 62 63 64 65 66 67 68 69 70 71 72 | #include <iostream>#include <fstream>#include "pin.H"using std::cerr;using std::endl;using std::ios;using std::ofstream;using std::string;ofstream OutFile;// The running count of instructions is kept here// make it static to help the compiler optimize docountstatic UINT64 icount = 0;// 这里就是我们调用的桩代码VOID docount() { icount++; }// Pin calls this function every time a new instruction is encountered// 遇到一条新指令,调用一次该函数VOID Instruction(INS ins, VOID* v){ // Insert a call to docount before every instruction, no arguments are passed // 指定调用的桩代码函数,执行插入操作,没有对桩代码函数进行传参 INS_InsertCall(ins, IPOINT_BEFORE, (AFUNPTR)docount, IARG_END);}// 处理输出文件,默认文件名为“inscount.out”KNOB< string > KnobOutputFile(KNOB_MODE_WRITEONCE, "pintool", "o", "inscount.out", "specify output file name");// This function is called when the application exitsVOID Fini(INT32 code, VOID* v){ // Write to a file since cout and cerr maybe closed by the application // 将输出保存到文件 OutFile.setf(ios::showbase); OutFile << "Count " << icount << endl; OutFile.close();}/* ===================================================================== *//* Print Help Message *//* ===================================================================== */INT32 Usage(){ cerr << "This tool counts the number of dynamic instructions executed" << endl; cerr << endl << KNOB_BASE::StringKnobSummary() << endl; return -1;}/* ===================================================================== *//* Main *//* ===================================================================== *//* argc, argv are the entire command line: pin -t <toolname> -- ... *//* ===================================================================== */int main(int argc, char* argv[]){ // Initialize pin 初始化 if (PIN_Init(argc, argv)) return Usage(); OutFile.open(KnobOutputFile.Value().c_str()); // Register Instruction to be called to instrument instructions // 注册插桩函数 INS_AddInstrumentFunction(Instruction, 0); // Register Fini to be called when the application exits // 注册程序退出时的处理函数 PIN_AddFiniFunction(Fini, 0); // Start the program, never returns // 开始执行 PIN_StartProgram(); return 0;} |
3. 指令地址跟踪(指令插桩)
功能:打印执行的指令的地址
运行和查看输出:
1 | $ ../../../pin -t obj-intel64/itrace.so -- /bin/lsMakefile atrace.o imageload.out itrace proccountMakefile.example imageload inscount0 itrace.o proccount.oatrace imageload.o inscount0.o itrace.out$ head itrace.out0x40001e900x40001e910x40001ee40x40001ee50x40001ee70x40001ee80x40001ee90x40001eea0x40001ef00x40001ee0$ |
原理:在调用分析程序时,Pin 允许传递指令指针、寄存器当前值、内存操作的有效地址、常量等数据给分析程序。完整的可传递的参数的类型如下:IARG_TYPE。将指令计数程序中的参数更改为 INS_InsertCall 来传递即将执行的指令的地址,将 docount 更改为 printip 来打印指令的地址,最后将输出写入到文件 itrace.out 中。
源码`source/tools/ManualExamples/itrace.cpp:
1 | #include <stdio.h>#include "pin.H"FILE* trace;// 在每条指令执行前都会被调用,打印出当前指令的地址VOID printip(VOID* ip) { fprintf(trace, "%p\n", ip); }// 遇到一条新指令调用一次VOID Instruction(INS ins, VOID* v){ // 在每条指令前插入对 printip 函数的调用,并传递 ip 参数 INS_InsertCall(ins, IPOINT_BEFORE, (AFUNPTR)printip, IARG_INST_PTR, IARG_END);}// 结束函数VOID Fini(INT32 code, VOID* v){ fprintf(trace, "#eof\n"); fclose(trace);}/* ===================================================================== *//* Print Help Message *//* ===================================================================== */INT32 Usage(){ PIN_ERROR("This Pintool prints the IPs of every instruction executed\n" + KNOB_BASE::StringKnobSummary() + "\n"); return -1;}/* ===================================================================== *//* Main *//* ===================================================================== */int main(int argc, char* argv[]){ trace = fopen("itrace.out", "w"); // 初始化 if (PIN_Init(argc, argv)) return Usage(); // 桩指令注册 INS_AddInstrumentFunction(Instruction, 0); // 结束逻辑注册 PIN_AddFiniFunction(Fini, 0); // 开始执行,不返回 PIN_StartProgram(); return 0;} |
4. 内存调用跟踪(指令插桩)
功能:内存引用追踪(只对读写内存的指令插桩)
运行和查看输出:
1 | $ ../../../pin -t obj-intel64/pinatrace.so -- /bin/lsMakefile atrace.o imageload.o inscount0.o itrace.outMakefile.example atrace.out imageload.out itrace proccountatrace imageload inscount0 itrace.o proccount.o$ head pinatrace.out0x40001ee0: R 0xbfffe7980x40001efd: W 0xbfffe7d40x40001f09: W 0xbfffe7d80x40001f20: W 0xbfffe8640x40001f20: W 0xbfffe8680x40001f20: W 0xbfffe86c0x40001f20: W 0xbfffe8700x40001f20: W 0xbfffe8740x40001f20: W 0xbfffe8780x40001f20: W 0xbfffe87c$ |
原理:Pin 中包含可以对指令进行分类和检查功能的 API,通过调用该 API 可以实现对某一类功能的函数的追踪。
源码source/tools/ManualExamples/itrace.cpp:
1 | /* * This file contains an ISA-portable PIN tool for tracing memory accesses. */#include <stdio.h>#include "pin.H"FILE* trace;// 打印地址读的指令的地址VOID RecordMemRead(VOID* ip, VOID* addr) { fprintf(trace, "%p: R %p\n", ip, addr); }// 打印地址写的指令的地址VOID RecordMemWrite(VOID* ip, VOID* addr) { fprintf(trace, "%p: W %p\n", ip, addr); }// 使用谓词函数调用来检测内存访问// 每个读和写的指令都会调用VOID Instruction(INS ins, VOID* v){ // 获取指令中的内存操作数计数 UINT32 memOperands = INS_MemoryOperandCount(ins); // 遍历指令中的每个内存操作数 for (UINT32 memOp = 0; memOp < memOperands; memOp++) { // 如果是内存读 if (INS_MemoryOperandIsRead(ins, memOp)) { INS_InsertPredicatedCall(ins, IPOINT_BEFORE, (AFUNPTR)RecordMemRead, IARG_INST_PTR, IARG_MEMORYOP_EA, memOp, IARG_END); } // 在某些架构下,内存操作数可以同时用作读和写,例如 IA-32 的 %eax,这种情况下只记录一次 // 如果是写 if (INS_MemoryOperandIsWritten(ins, memOp)) { INS_InsertPredicatedCall(ins, IPOINT_BEFORE, (AFUNPTR)RecordMemWrite, IARG_INST_PTR, IARG_MEMORYOP_EA, memOp, IARG_END); } }}VOID Fini(INT32 code, VOID* v){ fprintf(trace, "#eof\n"); fclose(trace);}/* ===================================================================== *//* Print Help Message *//* ===================================================================== */INT32 Usage(){ PIN_ERROR("This Pintool prints a trace of memory addresses\n" + KNOB_BASE::StringKnobSummary() + "\n"); return -1;}/* ===================================================================== *//* Main *//* ===================================================================== */int main(int argc, char* argv[]){ if (PIN_Init(argc, argv)) return Usage(); trace = fopen("pinatrace.out", "w"); // 注册桩函数 INS_AddInstrumentFunction(Instruction, 0); // 注册结束函数 PIN_AddFiniFunction(Fini, 0); // 开始,不返回 PIN_StartProgram(); return 0;} |
5. 检测image的加载和卸载(image插桩)
功能:在 image 加载和卸载时打印信息到 trace 文件中。
执行和查看输出:
1 | $ ../../../pin -t obj-intel64/imageload.so -- /bin/lsMakefile atrace.o imageload.o inscount0.o proccountMakefile.example atrace.out imageload.out itrace proccount.oatrace imageload inscount0 itrace.o trace.out$ cat imageload.outLoading /bin/lsLoading /lib/ld-linux.so.2Loading /lib/libtermcap.so.2Loading /lib/i686/libc.so.6Unloading /bin/lsUnloading /lib/ld-linux.so.2Unloading /lib/libtermcap.so.2Unloading /lib/i686/libc.so.6$ |
原理:本质上没有对 image 文件进行插桩。
源码 source/tools/ManualExamples/imageload.cpp:
1 | //// This tool prints a trace of image load and unload events//#include "pin.H"#include <iostream>#include <fstream>#include <stdlib.h>using std::endl;using std::ofstream;using std::string;KNOB< string > KnobOutputFile(KNOB_MODE_WRITEONCE, "pintool", "o", "imageload.out", "specify file name");ofstream TraceFile;// Pin 在 image 加载时调用该函数,在该例中没有进行插桩VOID ImageLoad(IMG img, VOID* v) { TraceFile << "Loading " << IMG_Name(img) << ", Image id = " << IMG_Id(img) << endl; }// Pin 在 image 卸载时调用该函数,对于将要卸载的image无法进行插桩VOID ImageUnload(IMG img, VOID* v) { TraceFile << "Unloading " << IMG_Name(img) << endl; }// This function is called when the application exits// It closes the output file.VOID Fini(INT32 code, VOID* v){ if (TraceFile.is_open()) { TraceFile.close(); }}/* ===================================================================== *//* Print Help Message *//* ===================================================================== */INT32 Usage(){ PIN_ERROR("This tool prints a log of image load and unload events\n" + KNOB_BASE::StringKnobSummary() + "\n"); return -1;}/* ===================================================================== *//* Main *//* ===================================================================== */int main(int argc, char* argv[]){ // 符号初始化 PIN_InitSymbols(); // pin 初始化 if (PIN_Init(argc, argv)) return Usage(); TraceFile.open(KnobOutputFile.Value().c_str()); // 注册加载桩函数 IMG_AddInstrumentFunction(ImageLoad, 0); // 注册卸载桩函数 IMG_AddUnloadFunction(ImageUnload, 0); // 注册退出函数 PIN_AddFiniFunction(Fini, 0); // 开始执行,无返回 PIN_StartProgram(); return 0;} |
6. 进阶版指令计数(trace 插桩)
功能:计算 BBL (单入口单出口)数量
执行和查看输出:
1 | $ ../../../pin -t obj-intel64/inscount1.so -o inscount.out -- /bin/lsMakefile atrace.o imageload.out itrace proccountMakefile.example imageload inscount0 itrace.o proccount.oatrace imageload.o inscount0.o itrace.out$ cat inscount.outCount 707208 |
原理:在每个 BBL 进行插桩来替代在每个指令进行插桩,在进行计数时,以 bbl 为单位,每次增加每个 bbl 中的指令数量。
源码 source/tools/ManualExamples/inscount1.cpp:
1 | #include <iostream>#include <fstream>#include "pin.H"using std::cerr;using std::endl;using std::ios;using std::ofstream;using std::string;ofstream OutFile;// 保存指令的运行次数,设置为静态变量以帮助编译器优化 docountstatic UINT64 icount = 0;// 在每个 block 前都会被调用VOID docount(UINT32 c) { icount += c; }// Pin 在遇到一个新的block 时进行调用,插入对 docount 函数的调用VOID Trace(TRACE trace, VOID* v){ // 访问 trace 中的每个 bbl for (BBL bbl = TRACE_BblHead(trace); BBL_Valid(bbl); bbl = BBL_Next(bbl)) { // 在每个 bbl 前插入对 docount 函数的调用,传入指令数量 BBL_InsertCall(bbl, IPOINT_BEFORE, (AFUNPTR)docount, IARG_UINT32, BBL_NumIns(bbl), IARG_END); }}KNOB< string > KnobOutputFile(KNOB_MODE_WRITEONCE, "pintool", "o", "inscount.out", "specify output file name");// 退出函数VOID Fini(INT32 code, VOID* v){ // 写入到文件中,程序可能会关闭 cout 和 cerr OutFile.setf(ios::showbase); OutFile << "Count " << icount << endl; OutFile.close();}/* ===================================================================== *//* Print Help Message *//* ===================================================================== */INT32 Usage(){ cerr << "This tool counts the number of dynamic instructions executed" << endl; cerr << endl << KNOB_BASE::StringKnobSummary() << endl; return -1;}/* ===================================================================== *//* Main *//* ===================================================================== */int main(int argc, char* argv[]){ // 初始化 pin if (PIN_Init(argc, argv)) return Usage(); OutFile.open(KnobOutputFile.Value().c_str()); // 注册插桩函数 TRACE_AddInstrumentFunction(Trace, 0); // 注册退出函数 PIN_AddFiniFunction(Fini, 0); // 开始执行,不返回 PIN_StartProgram(); return 0;} |
7. Procedure 指令计数(routine插桩)
功能:计算一个 procedure 被调用的次数,以及每个 procedure 中执行的命令总数。
执行和检查输出:
1 | $ ../../../pin -t obj-intel64/proccount.so -- /bin/grep proccount.cpp Makefileproccount_SOURCES = proccount.cpp$ head proccount.out Procedure Image Address Calls Instructions _fini libc.so.6 0x40144d00 1 21__deregister_frame_info libc.so.6 0x40143f60 2 70 __register_frame_info libc.so.6 0x40143df0 2 62 fde_merge libc.so.6 0x40143870 0 8 __init_misc libc.so.6 0x40115824 1 85 __getclktck libc.so.6 0x401157f4 0 2 munmap libc.so.6 0x40112ca0 1 9 mmap libc.so.6 0x40112bb0 1 23 getpagesize libc.so.6 0x4010f934 2 26$ |
源码 source/tools/ManualExamples/proccount.cpp:
1 | //// This tool counts the number of times a routine is executed and// the number of instructions executed in a routine//#include <fstream>#include <iomanip>#include <iostream>#include <string.h>#include "pin.H"using std::cerr;using std::dec;using std::endl;using std::hex;using std::ofstream;using std::setw;using std::string;ofstream outFile;// 保存 procedure 的指令数typedef struct RtnCount{ string _name; string _image; ADDRINT _address; RTN _rtn; UINT64 _rtnCount; UINT64 _icount; struct RtnCount* _next;} RTN_COUNT;// 每个 procedure 的指令数的链表RTN_COUNT* RtnList = 0;// 每条指令执行前调用VOID docount(UINT64* counter) { (*counter)++; }const char* StripPath(const char* path){ const char* file = strrchr(path, '/'); if (file) return file + 1; else return path;}// Pin 在一个新的 rtn 执行时调用该函数VOID Routine(RTN rtn, VOID* v){ // 对该routine设置一个计数器 RTN_COUNT* rc = new RTN_COUNT; // image unloaded 时, RTN 数据消失,所以在此处直接保存,后续 fini 中还要使用 rc->_name = RTN_Name(rtn); rc->_image = StripPath(IMG_Name(SEC_Img(RTN_Sec(rtn))).c_str()); rc->_address = RTN_Address(rtn); rc->_icount = 0; rc->_rtnCount = 0; // 添加到routines列表 rc->_next = RtnList; RtnList = rc; RTN_Open(rtn); // 在routine入口处插入一个call,增加call计数 RTN_InsertCall(rtn, IPOINT_BEFORE, (AFUNPTR)docount, IARG_PTR, &(rc->_rtnCount), IARG_END); // 对于routine中的每条指令 for (INS ins = RTN_InsHead(rtn); INS_Valid(ins); ins = INS_Next(ins)) { // 插入对docount函数的调用,增加该rtn中的指令计数 INS_InsertCall(ins, IPOINT_BEFORE, (AFUNPTR)docount, IARG_PTR, &(rc->_icount), IARG_END); } RTN_Close(rtn);}// 退出函数,打印每个procedure的名字和计数VOID Fini(INT32 code, VOID* v){ outFile << setw(23) << "Procedure" << " " << setw(15) << "Image" << " " << setw(18) << "Address" << " " << setw(12) << "Calls" << " " << setw(12) << "Instructions" << endl; for (RTN_COUNT* rc = RtnList; rc; rc = rc->_next) { if (rc->_icount > 0) outFile << setw(23) << rc->_name << " " << setw(15) << rc->_image << " " << setw(18) << hex << rc->_address << dec << " " << setw(12) << rc->_rtnCount << " " << setw(12) << rc->_icount << endl; }}/* ===================================================================== *//* Print Help Message *//* ===================================================================== */INT32 Usage(){ cerr << "This Pintool counts the number of times a routine is executed" << endl; cerr << "and the number of instructions executed in a routine" << endl; cerr << endl << KNOB_BASE::StringKnobSummary() << endl; return -1;}/* ===================================================================== *//* Main *//* ===================================================================== */int main(int argc, char* argv[]){ PIN_InitSymbols(); outFile.open("proccount.out"); if (PIN_Init(argc, argv)) return Usage(); // 注册桩函数 RTN_AddInstrumentFunction(Routine, 0); // 注册程序退出时的 fini函数 PIN_AddFiniFunction(Fini, 0); // 开始执行,不返回 PIN_StartProgram(); return 0;} |
下面是一些Pin的功能性特征说明样例。
8. PIN_SafeCopy() API
功能:从源内存区域复制指定数量的字节数到目的内存区域。即使源或目的区域不可访问,此函数也可保证安全返回给caller。此外,该API还可以读写程序的内存数据。
执行和查看输出:
1 | $ ../../../pin -t obj-ia32/safecopy.so -- /bin/cp makefile obj-ia32/safecopy.so.makefile.copy$ head safecopy.outEmulate loading from addr 0xbff0057c to ebxEmulate loading from addr 0x64ffd4 to eaxEmulate loading from addr 0xbff00598 to esiEmulate loading from addr 0x6501c8 to ediEmulate loading from addr 0x64ff14 to edxEmulate loading from addr 0x64ff1c to edxEmulate loading from addr 0x64ff24 to edxEmulate loading from addr 0x64ff2c to edxEmulate loading from addr 0x64ff34 to edxEmulate loading from addr 0x64ff3c to edx |
源码source/tools/ManualExamples/safecopy.cpp:
1 | #include <stdio.h>#include "pin.H"#include <iostream>#include <fstream>using std::cerr;using std::endl;std::ofstream* out = 0;//=======================================================// Analysis routines//=======================================================// 从内存转移到寄存器中ADDRINT DoLoad(REG reg, ADDRINT* addr){ *out << "Emulate loading from addr " << addr << " to " << REG_StringShort(reg) << endl; ADDRINT value; PIN_SafeCopy(&value, addr, sizeof(ADDRINT)); return value;}//=======================================================// Instrumentation routines//=======================================================VOID EmulateLoad(INS ins, VOID* v){ // Find the instructions that move a value from memory to a register if (INS_Opcode(ins) == XED_ICLASS_MOV && INS_IsMemoryRead(ins) && INS_OperandIsReg(ins, 0) && INS_OperandIsMemory(ins, 1)) { // op0 <- *op1 INS_InsertCall(ins, IPOINT_BEFORE, AFUNPTR(DoLoad), IARG_UINT32, REG(INS_OperandReg(ins, 0)), IARG_MEMORYREAD_EA,IARG_RETURN_REGS, INS_OperandReg(ins, 0), IARG_END); // Delete the instruction INS_Delete(ins); }}/* ===================================================================== *//* Print Help Message *//* ===================================================================== */INT32 Usage(){ cerr << "This tool demonstrates the use of SafeCopy" << endl; cerr << endl << KNOB_BASE::StringKnobSummary() << endl; return -1;}/* ===================================================================== *//* Main *//* ===================================================================== */int main(int argc, char* argv[]){ // Write to a file since cout and cerr maybe closed by the application out = new std::ofstream("safecopy.out"); // 初始化Pin,初始化符号 if (PIN_Init(argc, argv)) return Usage(); PIN_InitSymbols(); // 注册EmulateLoad函数以进行插桩 INS_AddInstrumentFunction(EmulateLoad, 0); // 开始执行,不返回 PIN_StartProgram(); return 0;} |
9. 插桩顺序
Pin提供了多种方式来控制analysis call的执行顺序,主要取决于insertion action(IPOINT)和call order(CALL_ORDER)。
执行和查看输出:
1 | $ ../../../pin -t obj-ia32/invocation.so -- obj-ia32/little_malloc$ head invocation.outAfter: IP = 0x64bc5eBefore: IP = 0x64bc5eTaken: IP = 0x63a12eAfter: IP = 0x64bc5eBefore: IP = 0x64bc5eTaken: IP = 0x641c76After: IP = 0x641ca6After: IP = 0x64bc5eBefore: IP = 0x64bc5eTaken: IP = 0x648b02 |
源码source/tools/ManualExamples/invocation.cpp:
1 | #include "pin.H"#include <iostream>#include <fstream>using std::cerr;using std::dec;using std::endl;using std::hex;using std::ios;using std::ofstream;using std::string;KNOB< string > KnobOutputFile(KNOB_MODE_WRITEONCE, "pintool", "o", "invocation.out", "specify output file name");ofstream OutFile;/* * Analysis routines */VOID Taken(const CONTEXT* ctxt){ ADDRINT TakenIP = (ADDRINT)PIN_GetContextReg(ctxt, REG_INST_PTR); OutFile << "Taken: IP = " << hex << TakenIP << dec << endl;}VOID Before(CONTEXT* ctxt){ ADDRINT BeforeIP = (ADDRINT)PIN_GetContextReg(ctxt, REG_INST_PTR); OutFile << "Before: IP = " << hex << BeforeIP << dec << endl;}VOID After(CONTEXT* ctxt){ ADDRINT AfterIP = (ADDRINT)PIN_GetContextReg(ctxt, REG_INST_PTR); OutFile << "After: IP = " << hex << AfterIP << dec << endl;}/* * Instrumentation routines */VOID ImageLoad(IMG img, VOID* v){ for (SEC sec = IMG_SecHead(img); SEC_Valid(sec); sec = SEC_Next(sec)) { // RTN_InsertCall()和INS_InsertCall()谁先出现谁先执行 // 在下面的代码中,IPOINT_AFTER在IPOINT_BEFORE之前执行。 for (RTN rtn = SEC_RtnHead(sec); RTN_Valid(rtn); rtn = RTN_Next(rtn)) { // 打开RTN. RTN_Open(rtn); // IPOINT_AFTER通过在一个routine中对每个return指令插桩实现。 // Pin会尝试查找所有的return指令,成不成功则是另外一回事(有点可爱23333)。 RTN_InsertCall(rtn, IPOINT_AFTER, (AFUNPTR)After, IARG_CONTEXT, IARG_END); // 检查routine中的每条指令 for (INS ins = RTN_InsHead(rtn); INS_Valid(ins); ins = INS_Next(ins)) { if (INS_IsRet(ins)) { // 插桩每条return指令 // IPOINT_TAKEN_BRANCH总是最后使用 INS_InsertCall(ins, IPOINT_BEFORE, (AFUNPTR)Before, IARG_CONTEXT, IARG_END); INS_InsertCall(ins, IPOINT_TAKEN_BRANCH, (AFUNPTR)Taken, IARG_CONTEXT, IARG_END); } } // 关闭RTN. RTN_Close(rtn); } }}VOID Fini(INT32 code, VOID* v) { OutFile.close(); }/* ===================================================================== *//* Print Help Message *//* ===================================================================== */INT32 Usage(){ cerr << "This is the invocation pintool" << endl; cerr << endl << KNOB_BASE::StringKnobSummary() << endl; return -1;}/* ===================================================================== *//* Main *//* ===================================================================== */int main(int argc, char* argv[]){ // 初始化 if (PIN_Init(argc, argv)) return Usage(); PIN_InitSymbols(); // 注册ImageLoad函数 IMG_AddInstrumentFunction(ImageLoad, 0); PIN_AddFiniFunction(Fini, 0); // 写入到文件 OutFile.open(KnobOutputFile.Value().c_str()); OutFile.setf(ios::showbase); // 开始执行,无返回 PIN_StartProgram(); return 0;} |
10. 查看函数参数值
功能:使用RTN_InsertCall()查看函数参数
执行和查看输出:
1 | $ ../../../pin -t obj-intel64/malloctrace.so -- /bin/cp makefile obj-intel64/malloctrace.so.makefile.copy$ cat malloctrace.outmalloc(0x5a1) returns 0x7f87d8ce2190malloc(0x4a1) returns 0x7f87d8ce2740malloc(0x10) returns 0x7f87d8ce2bf0malloc(0x9d) returns 0x7f87d8ce2c00malloc(0x28) returns 0x7f87d8ce2ca0malloc(0x140) returns 0x7f87d8ce2cd0malloc(0x26) returns 0x7f87d8ce2e10free(0)malloc(0x4b0) returns 0x7f87c4428000malloc(0x26) returns 0x7f87c44284b0malloc(0x22) returns 0x7f87c44284e0free(0)... ... |
源码source/tools/ManualExamples/malloctrace.cpp:
1 | #include "pin.H"#include <iostream>#include <fstream>using std::cerr;using std::endl;using std::hex;using std::ios;using std::string;/* ===================================================================== *//* Names of malloc and free *//* ===================================================================== */#if defined(TARGET_MAC)#define MALLOC "_malloc"#define FREE "_free"#else#define MALLOC "malloc"#define FREE "free"#endif/* ===================================================================== *//* Global Variables *//* ===================================================================== */std::ofstream TraceFile;/* ===================================================================== *//* Commandline Switches *//* ===================================================================== */KNOB< string > KnobOutputFile(KNOB_MODE_WRITEONCE, "pintool", "o", "malloctrace.out", "specify trace file name");/* ===================================================================== *//* ===================================================================== *//* Analysis routines *//* ===================================================================== */VOID Arg1Before(CHAR* name, ADDRINT size) { TraceFile << name << "(" << size << ")" << endl; }VOID MallocAfter(ADDRINT ret) { TraceFile << " returns " << ret << endl; }/* ===================================================================== *//* Instrumentation routines *//* ===================================================================== */VOID Image(IMG img, VOID* v){ // 对malloc和free函数进行插桩,打印出每个malloc或free函数的输入参数以及malloc的返回值 // 首先,查找malloc函数 RTN mallocRtn = RTN_FindByName(img, MALLOC); if (RTN_Valid(mallocRtn)) { RTN_Open(mallocRtn); // 对查找到的malloc()函数进行插桩打印其参数 RTN_InsertCall(mallocRtn, IPOINT_BEFORE, (AFUNPTR)Arg1Before, IARG_ADDRINT, MALLOC, IARG_FUNCARG_ENTRYPOINT_VALUE, 0,IARG_END); // 打印返回值 RTN_InsertCall(mallocRtn, IPOINT_AFTER, (AFUNPTR)MallocAfter, IARG_FUNCRET_EXITPOINT_VALUE, IARG_END); RTN_Close(mallocRtn); } // 查找free() RTN freeRtn = RTN_FindByName(img, FREE); if (RTN_Valid(freeRtn)) { RTN_Open(freeRtn); // 插桩,打印输入参数 RTN_InsertCall(freeRtn, IPOINT_BEFORE, (AFUNPTR)Arg1Before, IARG_ADDRINT, FREE, IARG_FUNCARG_ENTRYPOINT_VALUE, 0, IARG_END); RTN_Close(freeRtn); }}VOID Fini(INT32 code, VOID* v) { TraceFile.close(); }/* Print Help Message */INT32 Usage(){ cerr << "This tool produces a trace of calls to malloc." << endl; cerr << endl << KNOB_BASE::StringKnobSummary() << endl; return -1;}/* ===================================================================== *//* Main *//* ===================================================================== */int main(int argc, char* argv[]){ // 初始化 PIN_InitSymbols(); if (PIN_Init(argc, argv)) { return Usage(); } // 写入到文件 TraceFile.open(KnobOutputFile.Value().c_str()); TraceFile << hex; TraceFile.setf(ios::showbase); // 注册Image函数 IMG_AddInstrumentFunction(Image, 0); PIN_AddFiniFunction(Fini, 0); // 开始执行,不返回 PIN_StartProgram(); return 0;} |
11. 插桩线程应用
功能:在应用开启了线程环境下进行插桩,使用的callback为ThreadStart()和ThreadFini()。在使用时,为了防止与其他分析routine发生共享资源竞争的问题,可以使用PIN_GetLock()函数进行加锁处理。
执行和查看输出:
1 | $ ../../../pin -t obj-ia32/malloc_mt.so -- obj-ia32/thread_lin$ head malloc_mt.outthread begin 0thread 0 entered malloc(24d)thread 0 entered malloc(57)thread 0 entered malloc(c)thread 0 entered malloc(3c0)thread 0 entered malloc(c)thread 0 entered malloc(58)thread 0 entered malloc(56)thread 0 entered malloc(19)thread 0 entered malloc(25c) |
源码source/tools/ManualExamples/malloc_mt.cpp:
1 | #include <stdio.h>#include "pin.H"using std::string;KNOB< string > KnobOutputFile(KNOB_MODE_WRITEONCE, "pintool", "o", "malloc_mt.out", "specify output file name");//==============================================================// Analysis Routines//==============================================================// Note: threadid+1 作为PIN_GetLock()的参数使用,它的值也就是lock的值,所以不能为0// lock会序列化对输出文件的访问。FILE* out;PIN_LOCK pinLock;// 每次创建线程,该routine都会被调用执行。VOID ThreadStart(THREADID threadid, CONTEXT* ctxt, INT32 flags, VOID* v){ PIN_GetLock(&pinLock, threadid + 1); // 加锁 fprintf(out, "thread begin %d\n", threadid); fflush(out); PIN_ReleaseLock(&pinLock); // 解锁}// 每次销毁线程,该routine都会被调用执行VOID ThreadFini(THREADID threadid, const CONTEXT* ctxt, INT32 code, VOID* v){ PIN_GetLock(&pinLock, threadid + 1); fprintf(out, "thread end %d code %d\n", threadid, code); fflush(out); PIN_ReleaseLock(&pinLock);}// 每次调用malloc函数,该routine都会被调用执行VOID BeforeMalloc(int size, THREADID threadid){ PIN_GetLock(&pinLock, threadid + 1); fprintf(out, "thread %d entered malloc(%d)\n", threadid, size); fflush(out); PIN_ReleaseLock(&pinLock);}//====================================================================// Instrumentation Routines//====================================================================// 对每个image都执行VOID ImageLoad(IMG img, VOID*){ RTN rtn = RTN_FindByName(img, "malloc"); if (RTN_Valid(rtn)) { RTN_Open(rtn); RTN_InsertCall(rtn, IPOINT_BEFORE, AFUNPTR(BeforeMalloc), IARG_FUNCARG_ENTRYPOINT_VALUE, 0, IARG_THREAD_ID, IARG_END); RTN_Close(rtn); }}// 在结束时执行一次VOID Fini(INT32 code, VOID* v) { fclose(out); }/* ===================================================================== *//* Print Help Message *//* ===================================================================== */INT32 Usage(){ PIN_ERROR("This Pintool prints a trace of malloc calls in the guest application\n" + KNOB_BASE::StringKnobSummary() + "\n"); return -1;}/* ===================================================================== *//* Main *//* ===================================================================== */int main(INT32 argc, CHAR** argv){ // 初始化pin的lock PIN_InitLock(&pinLock); // 初始化pin if (PIN_Init(argc, argv)) return Usage(); PIN_InitSymbols(); out = fopen(KnobOutputFile.Value().c_str(), "w"); // 注册ImageLoad函数 IMG_AddInstrumentFunction(ImageLoad, 0); // 注册线程创建或结束时的分析routine PIN_AddThreadStartFunction(ThreadStart, 0); PIN_AddThreadFiniFunction(ThreadFini, 0); // 注册程序退出时的fini函数 PIN_AddFiniFunction(Fini, 0); // 开始执行,不返回 PIN_StartProgram(); return 0;} |
12. 使用TLS(Thread Local Storage)
功能:可以使工具创建线程特定的数据
执行和查看输出:
1 | $ ../../../pin -t obj-ia32/inscount_tls.so -- obj-ia32/thread_lin$ headCount[0]= 237993Count[1]= 213296Count[2]= 209223Count[3]= 209223Count[4]= 209223Count[5]= 209223Count[6]= 209223Count[7]= 209223Count[8]= 209223Count[9]= 209223 |
源码source/tools/ManualExamples/inscount_tls.cpp:
1 | #include <iostream>#include <fstream>#include "pin.H"using std::cerr;using std::cout;using std::endl;using std::ostream;using std::string;KNOB< string > KnobOutputFile(KNOB_MODE_WRITEONCE, "pintool", "o", "", "specify output file name");INT32 numThreads = 0;ostream* OutFile = NULL;// 强制每个线程的数据存储在自己的数据缓存行中,确保多线程不会发生同一数据缓存行的竞争问题。// 避免错误共享的问题。#define PADSIZE 56 // 64 byte line size: 64-8// 运行的指令计数class thread_data_t{ public: thread_data_t() : _count(0) {} UINT64 _count; UINT8 _pad[PADSIZE];};// 存储在线程中的访问TLS的key,只在main函数中初始化一次static TLS_KEY tls_key = INVALID_TLS_KEY;// 该函数在每个block前调用VOID PIN_FAST_ANALYSIS_CALL docount(UINT32 c, THREADID threadid){ thread_data_t* tdata = static_cast< thread_data_t* >(PIN_GetThreadData(tls_key, threadid)); tdata->_count += c;}VOID ThreadStart(THREADID threadid, CONTEXT* ctxt, INT32 flags, VOID* v){ numThreads++; thread_data_t* tdata = new thread_data_t; if (PIN_SetThreadData(tls_key, tdata, threadid) == FALSE) { cerr << "PIN_SetThreadData failed" << endl; PIN_ExitProcess(1); }}// 遇到新的代码块时调用,插入对docount函数的调用VOID Trace(TRACE trace, VOID* v){ // 检查trace中的每个基本块 for (BBL bbl = TRACE_BblHead(trace); BBL_Valid(bbl); bbl = BBL_Next(bbl)) { // 对每个bbl插入对docount的调用,并传递参数:指令的数量 BBL_InsertCall(bbl, IPOINT_ANYWHERE, (AFUNPTR)docount, IARG_FAST_ANALYSIS_CALL, IARG_UINT32, BBL_NumIns(bbl), IARG_THREAD_ID, IARG_END); }}// 线程退出时调用VOID ThreadFini(THREADID threadIndex, const CONTEXT* ctxt, INT32 code, VOID* v){ thread_data_t* tdata = static_cast< thread_data_t* >(PIN_GetThreadData(tls_key, threadIndex)); *OutFile << "Count[" << decstr(threadIndex) << "] = " << tdata->_count << endl; delete tdata;}// 程序退出时调用VOID Fini(INT32 code, VOID* v) { *OutFile << "Total number of threads = " << numThreads << endl; }/* ===================================================================== *//* Print Help Message *//* ===================================================================== */INT32 Usage(){ cerr << "This tool counts the number of dynamic instructions executed" << endl; cerr << endl << KNOB_BASE::StringKnobSummary() << endl; return 1;}/* ===================================================================== *//* Main *//* ===================================================================== */int main(int argc, char* argv[]){ PIN_InitSymbols(); if (PIN_Init(argc, argv)) return Usage(); OutFile = KnobOutputFile.Value().empty() ? &cout : new std::ofstream(KnobOutputFile.Value().c_str()); // 设置key tls_key = PIN_CreateThreadDataKey(NULL); if (tls_key == INVALID_TLS_KEY) { cerr << "number of already allocated keys reached the MAX_CLIENT_TLS_KEYS limit" << endl; PIN_ExitProcess(1); } // 注册线程创建时调用的ThreadStart函数 PIN_AddThreadStartFunction(ThreadStart, NULL); // 注册线程结束时调用的ThreadFini函数 PIN_AddThreadFiniFunction(ThreadFini, NULL); // 注册程序结束时的Fini函数 PIN_AddFiniFunction(Fini, NULL); // 注册指令插桩时调用的Trace函数 TRACE_AddInstrumentFunction(Trace, NULL); // Start the program, never returns PIN_StartProgram(); return 1;} |
13. 查看image的静态属性
功能:不对binary文件进行插桩,静态获取文件的指令数量。
源码source/tools/ManualExamples/staticcount.cpp:
1 | //// This tool prints a trace of image load and unload events//#include <stdio.h>#include <iostream>#include "pin.H"using std::cerr;using std::endl;// 在img加载时调用该函数,计算image中的静态指令数量VOID ImageLoad(IMG img, VOID* v){ UINT32 count = 0; for (SEC sec = IMG_SecHead(img); SEC_Valid(sec); sec = SEC_Next(sec)) { for (RTN rtn = SEC_RtnHead(sec); RTN_Valid(rtn); rtn = RTN_Next(rtn)) { // 准备处理RTN,RTN并不会分解成bbl,只是INS的一个序列 RTN_Open(rtn); for (INS ins = RTN_InsHead(rtn); INS_Valid(ins); ins = INS_Next(ins)) { count++; } // 在处理完与RTN相关的数据后就进行释放,以节省空间 RTN_Close(rtn); } } fprintf(stderr, "Image %s has %d instructions\n", IMG_Name(img).c_str(), count);}/* ===================================================================== *//* Print Help Message *//* ===================================================================== */INT32 Usage(){ cerr << "This tool prints a log of image load and unload events" << endl; cerr << " along with static instruction counts for each image." << endl; cerr << endl << KNOB_BASE::StringKnobSummary() << endl; return -1;}/* ===================================================================== *//* Main *//* ===================================================================== */int main(int argc, char* argv[]){ // 初始化符号 PIN_InitSymbols(); // 初始化pin if (PIN_Init(argc, argv)) return Usage(); // 注册img加载后要调用的ImageLoad函数 IMG_AddInstrumentFunction(ImageLoad, 0); // 开始执行,不返回 PIN_StartProgram(); return 0;} |
14. 插桩子进程
功能:在通过execv类命令获得进程开始前执行自定义的函数。
执行和查看输出:在执行时添加-follow_execv选项。
1 | $ ../../../pin -follow_execv -t obj-intel64/follow_child_tool.so -- obj-intel64/follow_child_app1 obj-intel64/follow_child_app2$ make follow_child_tool.test |
源码source/tools/ManualExamples/follow_child_tool.cpp:
1 | #include "pin.H"#include <iostream>#include <stdio.h>#include <unistd.h>/* ===================================================================== *//* Command line Switches *//* ===================================================================== */BOOL FollowChild(CHILD_PROCESS cProcess, VOID* userData){ fprintf(stdout, "before child:%u\n", getpid()); return TRUE;}/* ===================================================================== */int main(INT32 argc, CHAR** argv){ PIN_Init(argc, argv); // 注册子进程刚创建时要执行的FollowChild函数 PIN_AddFollowChildProcessFunction(FollowChild, 0); // 开始执行,不返回 PIN_StartProgram(); return 0;} |
15. 在fork前和fork后插桩
功能:使用PIN_AddForkFunction()和PIN_AddForkFunctionProbed()回调函数来在以下的FPOINT处执行自定义函数:
1 | FPOINT_BEFORE Call-back in parent, just before fork.FPOINT_AFTER_IN_PARENT Call-back in parent, immediately after fork.FPOINT_AFTER_IN_CHILD Call-back in child, immediately after fork. |
PIN_AddForkFunction()工作在JIT模式下,PIN_AddForkFunctionProbed()工作在Probe模式下。
执行和查看输出:
1 | $ make fork_jit_tool.test |
源码source/tools/ManualExamples/fork_jit_tool.cpp:
1 | #include <stdio.h>#include <sys/types.h>#include <unistd.h>#include <stdlib.h>#include "pin.H"#include <iostream>#include <fstream>using std::cerr;using std::endl;INT32 Usage(){ cerr << "This pin tool registers callbacks around fork().\n" "\n"; cerr << KNOB_BASE::StringKnobSummary(); cerr << endl; return -1;}pid_t parent_pid;PIN_LOCK pinLock;VOID BeforeFork(THREADID threadid, const CONTEXT* ctxt, VOID* arg){ PIN_GetLock(&pinLock, threadid + 1); cerr << "TOOL: Before fork." << endl; PIN_ReleaseLock(&pinLock); parent_pid = PIN_GetPid();}VOID AfterForkInParent(THREADID threadid, const CONTEXT* ctxt, VOID* arg){ PIN_GetLock(&pinLock, threadid + 1); cerr << "TOOL: After fork in parent." << endl; PIN_ReleaseLock(&pinLock); if (PIN_GetPid() != parent_pid) { cerr << "PIN_GetPid() fails in parent process" << endl; exit(-1); }}VOID AfterForkInChild(THREADID threadid, const CONTEXT* ctxt, VOID* arg){ PIN_GetLock(&pinLock, threadid + 1); cerr << "TOOL: After fork in child." << endl; PIN_ReleaseLock(&pinLock); if ((PIN_GetPid() == parent_pid) || (getppid() != parent_pid)) { cerr << "PIN_GetPid() fails in child process" << endl; exit(-1); }}int main(INT32 argc, CHAR** argv){ PIN_InitSymbols(); if (PIN_Init(argc, argv)) { return Usage(); } // Initialize the pin lock PIN_InitLock(&pinLock); // Register a notification handler that is called when the application // forks a new process. PIN_AddForkFunction(FPOINT_BEFORE, BeforeFork, 0); PIN_AddForkFunction(FPOINT_AFTER_IN_PARENT, AfterForkInParent, 0); PIN_AddForkFunction(FPOINT_AFTER_IN_CHILD, AfterForkInChild, 0); // Never returns PIN_StartProgram(); return 0;} |
4. 回调
这部分主要介绍几个Pin的用于注册回调函数的API:
- INS_AddInstrumentFunction (INSCALLBACK fun, VOID *val):注册以指令粒度插桩的函数
- TRACE_AddInstrumentFunction (TRACECALLBACK fun, VOID *val):注册以trace粒度插桩的函数
- RTN_AddInstrumentFunction (RTNCALLBACK fun, VOID *val):注册以routine粒度插桩的函数
- IMG_AddInstrumentFunction (IMGCALLBACK fun, VOID *val):注册以image粒度插桩的函数
- PIN_AddFiniFunction (FINICALLBACK fun, VOID *val):注册在应用程序退出前执行的函数,该类函数不进行插桩,可以有多个。
- PIN_AddDetachFunction (DETACHCALLBACK fun, VOID *val):注册在Pin通过
PIN_Detach()函数放弃对应用程序的控制权限之前执行的函数,一个进程只调用一次,可以被任何线程调用,此时Pin的内存并没有释放。
对于每个注册函数的第二个参数val将在“回调”时传递给回调函数。如果在实际的场景中不需要传递第二个参数,为了保证安全,可以传递将val的值设置为0进行传递。val的理想使用方式是传递一个指向类实例的指针,这样回调函数在取消引用该指针前需要将其转换回一个对象。
所有的注册函数都会返回一个PIN_CALLBACK对象,该对象可以在后续过程中用于操作注册的回调的相关属性。
PIN回调操作相关API
在注册函数返回PIN_CALLBACK对象后,可以使用PIN_CALLBACKAPI对其进行操作,来检索和修改在Pin中已注册的回调函数的属性。
声明:
1 | typedef COMPLEX_CALLBACKVAL_BASE * PIN_CALLBACK |
函数:
CALLBACK_GetExecutionOrder()
声明:
1VOID CALLBACK_GetExecutionOrder (PIN_CALLBACK callback)作用:获取已注册回调函数的执行顺序。越靠前,越早被执行。
参数:
callback,从*_Add*Funcxtion()函数返回的注册的回调函数CALLBACK_SetExecutionOrder()
声明:
1VOID CALLBACK_SetExecutionOrder (PIN_CALLBACK callback, CALL_ORDER order)作用:设置已注册回调函数的执行顺序。越靠前,越早被执行。
参数:
callback,从*_Add*Funcxtion()函数返回的注册的回调函数;order,新设置的回调函数的执行顺序。PIN_CALLBACK_INVALID()
声明:
1const PIN_CALLBACK PIN_CALLBACK_INVALID(0)PIN回调的无效值。
CALL_ORDER
CALL_ORDER是一个枚举类型,预定义了IARG_CALL_ORDER的值。其作用就是当指令有多个分析函数调用时,控制每个分析函数的调用顺序,默认值为CALL_ORDER_DEFAULT。
- CALL_ORDER_FIRST:首先执行该调用,整数值为100.
- CALL_ORDER_DEFAULT:未指定
IARG_CALL_ORDER时的默认值,整数值为200. - CALL_ORDER_LAST:最后执行该调用,整数值为300.
在进行数值设定时,可以使用类似CALL_ORDER_DEFAULT + 5的格式来设置。
针对在相同插桩回调环境中的针对同一指令的、具备同样CALL_ORDER的多个分析调用,Pin会按照插入的顺序进行调用。
5. 修改程序指令
虽然Pin的主要用途是对二进制程序进行插桩,但是它也可以实现对程序指令的修改。
5.1 实现方式
最简单的实现方式是插入一个分析routine来模拟指令执行,然后调用INS_Delete()来删除指令。也可以通过直接或间接插入程序执行流分支(使用INS_InsertDirectJump和INS_InsertIndirectJump)实现,这种方式会改变程序的执行流,但是会更容易实现指令模拟。
INS_InsertDirectJump()
声明:
1VOID INS_InsertDirectJump(INS ins, IPOINT ipoint, ADDRINT tgt)参数:
- ins:输入的指令
- ipoint:与ins相关的location(仅支持IPOINT_BEFORE和IPOINT_AFTER)
- tgt:target的绝对地址
作用:插入相对于给定指令的直接跳转指令,与
INS_Delete()配合使用可以模拟控制流转移指令。INS_InsertIndirectJump()
声明:
1VOID INS_InsertIndirectJump ( INS ins, IPOINT ipoint, REG reg)参数:
- ins:输入的指令
- ipoint:与ins相关的location(仅支持IPOINT_BEFORE和IPOINT_AFTER
- reg:target的寄存器
作用:插入相对于给定指令的间接跳转指令,与
INS_Delete()配合使用可以模拟控制流转移指令。
5.2 指令内存修改
对于原始指令使用到的内存的访问,可以通过使用INS_RewriteMemoryOperand来引用通过分析routine计算得到的值来替代。
需要注意的是,对于指令的修改操作,会在所有的指令插桩操作完成后进行,因此在进行指令插桩时,插桩routine看到的都是原始的、没有经过修改的程序指令。
INS_RewriteMemoryOperand()
声明:
1 | VOID INS_RewriteMemoryOperand(INS ins, UINt32 memindex, REG newBase) |
参数:
- ins:输入指令
- memindex:控制需要重写的内存操作数(0,1,...)
- newBase:包含新操作数地址的寄存器,通常是通过
PIN_ClainToolRegister分配的临时寄存器
作用:更改此内存访问指令以饮用包含在给定特定寄存器中的虚拟内存地址。
在IA-32和Intel 64平台上,修改后的操作数仅使用具有新基址寄存器newBase的基址寄存器进行寻址。原始指令中该操作数的任何index, scale或者offset filed都会被删除。
该函数可以用于重写内存操作数,包括隐式的(如call、ret、push、pop),唯一不能重写的指令是第二个操作数大于0的enter。
newBase中的地址是中是该操作数将访问的最低地址,如果操作数在内存访问之前被指令修改,如push,则newBase中的值将不是堆栈指针,而是指令访问的内存地址。
用于内存地址重写的一个样例插桩代码如下:
1 | // 映射originalEa到一个翻译后的地址static ADDRINT ProcessAddress(ADDRINT originalEa, ADDRINT size, UINT32 access);... for (UINT32 op = 0; op<INS_MemoryOperandCount(ins); op++) // 首先遍历内存操作指令进行计数 { UINT32 access = (INS_MemoryOperandIsRead(ins,op) ? 1 : 0) | // 判断是内存读还是内存写 (INS_MemoryOperandIsWritten(ins,op) ? 2 : 0); INS_InsertCall(ins, IPOINT_BEFORE, AFUNPTR(ProcessAddress), IARG_MEMORYOP_EA, op, IARG_MEMORYOP_SIZE, op, IARG_UINT32, access, IARG_RETURN_REGS, REG_INST_G0+i, IARG_END); // 在指令处进行插桩 INS_RewriteMemoryOperand(ins, i, REG(REG_INST_G0+i)); // 重写内存指令的操作数 } |
6. 应用Pintool
命令行:
1 | pin [pin-option]... -t [toolname] [tool-options]... -- [application] [application-option].. |
6.1 Pin命令行选项
如下是Pin的命令行的完整option列表:
| Option | Description |
|---|---|
| -follow_execv | 使用Pin执行由execv类系统调用产生的所有进程 |
| -help | 帮助信息 |
| -pause_tool <n> | 暂停并打印PID以可以在tool加载后attach到debugger,处理过程在‘n’秒后重启 |
| -logfile | 指定log文件的名字和路径,默认路径为当前工作目录,默认文件名为pin.log |
| -unique_logfile | 添加pid到log文件名中 |
| -error_file | 指定error文件的名字和路径,默认路径为当前工作目录。如果设置了error文件,则所有error都会写入到文件中,并且不会在console中显示。如果没有指定,则不创建文件。 |
| -unique_error_file | 添加pid到error文件名中 |
| -injection <mode> | <mode>的选项为dynamic, self, child, parent,只能在UNIX中使用,详看Injection,默认使用dynamic。 |
| -inline | 内联简单的分析routine |
| -log_inline | 在pin.log文件中记录哪些分析routine被设置成了内联 |
| -cc_memory_size <n> | 最大代码缓存,字节为单位。0为默认值,表示不做限制。必须设置为代码缓存块大小的对齐倍数。 |
| -pid <pid #> | 使用Pin和Pintool attach一个正在运行的进程 |
| -pin_memory_range | 限制Pin到一个内存范围内,0x80000000:0x90000000 or size: 0:0x10000000. |
| -restric_memory | 阻止Pin的动态加载器使用该地址范围:0x10000000:0x20000000 |
| -pin_memory_size | 限制Pin和Pintool可以动态分配的字节数。Pin分配的字节数定义为Pin分配的内存页数乘以页大小。 |
| -tool_load_option | 加载有附加标志的tool。 |
| -t <toolname> | 指定加载的Pintool。 |
| -t64 <64-bit toolname> | 指定针对Intel 64架构的64-bit的Pintool。 |
| -p32 <toolname> | 指定IA-32架构下的Pintool |
| -p64 <toolname> | 指定针对Intel 64架构的Pintool |
| -smc-support | 是否开启app的SMC功能,1开启,0关闭。默认开启 |
| -smc_strict | 是否开启基本块内部的SMC,1开始,0关闭。默认关闭 |
| -appdebug | 调试目标程序,程序运行后立即在debugger中断下 |
| -appdebug_enable | 开启目标程序调试功能,但是在程序运行后不暂停 |
| -appdebug_silent | 当程序调试功能开启时,Pin打印消息告知如何连接外部debugger。但是在-appdebug_connection选项开启时不打印。 |
| -appdebug_exclude | 当程序调试功能开启,并指定了-follw_execv时,默认在所有子进程上启用调试。 |
| -appdebug_allow_remote | 允许debugger与Pin不运行在同一系统上,而是以远程方式进行连接。指定 -appdebug_connection 时会忽略该选项的值,因为 -appdebug_connection 明确指定了运行debugger的machine。 |
| -appdebug_connection | 当程序开启调试时,Pin默认会开启一个TCP端口等待debugger的连接。在开启该选项时,会在debugger中开启一个TCP端口来等待Pin的连接,相当于反置了默认的机制。该选项的格式为"[ip]:port",“ip”以点十进制格式表达,如果省略了ip,则会连接本地的端口,端口号为十进制表示。需要注意的是,debugger为GDB时,不使用该选项。 |
| -detach_reattach | 允许在probe模式下进行detach和reattach,仅在Windows平台下使用。 |
| -debug_instrumented_processes | 允许debugger对经过插桩的进程进行attach,仅在Windows平台下使用。 |
| -show_asserts | 健全性检查 |
此外,还支持如下的tool options,它们需要跟在tool名字后面,但是要在--符号前:
| Option | Description |
|---|---|
| -logifle | 指定log文件的名字和路径,默认路径为当前工作目录,默认文件名为pintool.log |
| -unique_logfile | 添加pid到log文件名中 |
| -discard_line_info <module_name> | 忽略特定模块的信息,模块名应该为没有路径的短文件名,不能是符号链接 |
| -discard_line_info_all | 忽略所有模块的信息 |
| -help | 帮助信息 |
| -support_jit_api | 启用托管平台支持 |
| -short_name | 使用最短的RTN名称。 |
| -symbol_path <list of paths> | 指定用分号分隔的路径列表,用于搜索以查找符号和行信息。仅在Windows平台下使用。 |
| -slow_asserts | 健全性检查 |
6.2 在Intel(R) 64架构插桩
IA-32和Intel(R) 64架构的Pin kit是一个组合kit,均包含32-bit和64-bit的版本。这就为复杂的环境提供了极高的可运行性,例如一个稍微有点复杂的运行如下:
1 | pin [pin-option]... -t64 <64-bit toolname> -t <32-bit toolname> [tool-options]...-- <application> [application-option].. |
需要注意的是:
- -t64选项需要用在-t选项的前面
- 当-t64和-t一起使用时,-t后面跟的时32-bit的tool。不推荐使用不带-t的-t64,因为在这种情况下,当给定32-bit应用程序时,Pin将在不应用任何工具的情况下运行该应用程序。
- [tool-option]会同时作用于64-bit和32-bit的tool,并且必须在-t <32-bit toolname>后面进行指定。
6.3 注入
选项-injection仅在UNIX平台下可以使用,该选项控制着Pin注入到目标程序进程的方式。
默认情况下,建议使用dynamic模式。在该模式下,使用的是对父进程注入的方式,除非是系统内核不支持。子进程注入方式会创建一个pin的子进程,所以会看到pin进程和目标程序进程同时运行。使用父进程注入方式时,pin进程会在注入完成后退出,所以相对来说比较稳定。在不支持的平台上使用父进程注入方式可能出现意料之外的问题。
7. 编写Pintool
7.1 记录Pintool的消息
Pin提供了将Pintool的messages写入到文件的机制——LOG() api,在合适的获取message的位置使用即可。默认的文件名为pintool.log,存储路径为当前工作目录,可以使用-logfile选项来改变log文件的路径和名字。
1 | LOG( "Replacing function in " + IMG_Name(img) + "\n" );LOG( "Address = " + hexstr( RTN_Address(rtn)) + "\n" );LOG( "Image ID = " + decstr( IMG_Id(img) ) + "\n" ); |
7.2 编写Pintool时的性能考量
Pintool的开发质量会很大程度上决定tool的性能如何,例如在进行插桩时的速度问题。将通过一个例子来介绍一些提高tool性能的技巧。
首先是插桩部分代码:
1 | VOID Instruction(INS ins, void *v){ ... if ( [ins is a branch or a call instruction] ) { INS_InsertCall(ins, IPOINT_BEFORE, (AFUNPTR) docount2, IARG_INST_PTR, IARG_BRANCH_TARGET_ADDR, IARG_BRANCH_TAKEN, IARG_END); } ...} |
然后是分析代码:
1 | VOID docount2( ADDRINT src, ADDRINT dst, INT32 taken ){ if(!taken) return; COUNTER *pedg = Lookup( src,dst ); pedg->_count++;} |
该工具的目的是计算控制流图中每个控制流变化的边界被遍历的频率。工作原理如下:插桩组件通过调用docount2对每个分支进行插桩。传入的参数为源分支和目标分支以及分支是否被执行。源分支和目标分支代表来控制流边界的源和目的。如果没有执行分支,控制流不会发生改变,因此分析routine会立即返回。如果执行了分支,就使用src和dst参数来查找与此边界相关的计数器,并增加计数器的值。
Shifting Computation for Analysis to Instrumentation Code
在一个典型的应用程序中,大概每5条指令构成一个分支,在这些指令执行时会调用Lookup函数,造成性能下降。我们思考这个过程可以发现,在指令执行时,每条指令只会调用一次插桩代码,但会多次调用分析代码。所以,可以想办法将计算工作从分析代码转移到插桩代码,这样就可以降低调用次数,从而提升性能。
首先,就大多数分支而言,我们可以在Instruction()中找到目标分支。对于这些分支,我们可以在Instruction()内部调用Lookup()而不是docount2(),对于相对较少的间接分支,我们仍然需要使用原来的方法。
因此,我们增加一个新的函数docount,原来的docount2函数保持不变:
1 | VOID docount( COUNTER *pedg, INT32 taken ){ if( !taken ) return; pedg->_count++;} |
相应地,修改插桩函数:
1 | VOID Instruction(INS ins, void *v){ ... if (INS_IsDirectControlFlow(ins)) { COUNTER *pedg = Lookup( INS_Address(ins), INS_DirectControlFlowTargetAddress(ins) ); INS_InsertCall(ins, IPOINT_BEFORE, (AFUNPTR) docount, IARG_ADDRINT, pedg, IARG_BRANCH_TAKEN, IARG_END); } else { INS_InsertCall(ins, IPOINT_BEFORE, (AFUNPTR) docount2, IARG_INST_PTR, IARG_BRANCH_TARGET_ADDR, IARG_BRANCH_TAKEN, IARG_END); } ...} |
在插桩函数内部根据不同的情况,执行不同的分析代码,避免对所有类型的指令都笼统地调用性能要求高docount2函数。
最终实现的完整代码如下:
1 | /*! @file * This file contains an ISA-portable PIN tool for tracing instructions */#include <iostream>#include <fstream>#include <map>#include <unistd.h>#include "pin.H"using std::cerr;using std::endl;using std::map;using std::pair;using std::string;/* ===================================================================== *//* Commandline Switches *//* ===================================================================== */KNOB< string > KnobOutputFile(KNOB_MODE_WRITEONCE, "pintool", "o", "edgcnt.out", "specify trace file name");KNOB< INT32 > KnobFilterByHighNibble(KNOB_MODE_WRITEONCE, "pintool", "f", "-1", "only instrument instructions with a code address matching the filter");KNOB< BOOL > KnobPid(KNOB_MODE_WRITEONCE, "pintool", "i", "0", "append pid to output");/* ===================================================================== *//* Print Help Message *//* ===================================================================== */static INT32 Usage(){ cerr << "This pin tool collects an edge profile for an application\n"; cerr << "The edge profile is partial as it only considers control flow changes (taken\n"; cerr << "branch edges, etc.). It is the left to the profile consumer to compute the missing counts.\n"; cerr << "\n"; cerr << "The pin tool *does* keep track of edges from indirect jumps within, out of, and into\n"; cerr << "the application. Traps to the OS a recorded with a target of -1.\n"; cerr << KNOB_BASE::StringKnobSummary() << endl; return -1;}/* ===================================================================== *//* Global Variables *//* ===================================================================== */class COUNTER{ public: UINT64 _count; // 边界到达的次数,计数器 COUNTER() : _count(0) {}};typedef enum{ ETYPE_INVALID, ETYPE_CALL, ETYPE_ICALL, ETYPE_BRANCH, ETYPE_IBRANCH, ETYPE_RETURN, ETYPE_SYSCALL, ETYPE_LAST} ETYPE;class EDGE{ public: ADDRINT _src; ADDRINT _dst; ADDRINT _next_ins; ETYPE _type; // 必须为整数形式 EDGE(ADDRINT s, ADDRINT d, ADDRINT n, ETYPE t) : _src(s), _dst(d), _next_ins(n), _type(t) {} bool operator<(const EDGE& edge) const { return _src < edge._src || (_src == edge._src && _dst < edge._dst); }};string StringFromEtype(ETYPE etype){ switch (etype) { case ETYPE_CALL: return "C"; case ETYPE_ICALL: return "c"; case ETYPE_BRANCH: return "B"; case ETYPE_IBRANCH: return "b"; case ETYPE_RETURN: return "r"; case ETYPE_SYSCALL: return "s"; default: ASSERTX(0); return "INVALID"; }}typedef map< EDGE, COUNTER* > EDG_HASH_SET;static EDG_HASH_SET EdgeSet;/* ===================================================================== *//*! 对于已经进行过插桩的Edge,重用entry;否则创建一个新的。 */static COUNTER* Lookup(EDGE edge) // 查找边界{ COUNTER*& ref = EdgeSet[edge]; if (ref == 0) { ref = new COUNTER(); } return ref;}/* ===================================================================== */// 分析routine代码VOID docount(COUNTER* pedg) { pedg->_count++; }/* ===================================================================== */// 对于间接控制流,我们不知道边界,所以需要进行查找。VOID docount2(ADDRINT src, ADDRINT dst, ADDRINT n, ETYPE type, INT32 taken){ if (!taken) return; COUNTER* pedg = Lookup(EDGE(src, dst, n, type)); pedg->_count++;}/* ===================================================================== */VOID Instruction(INS ins, void* v) // 插桩函数{ if (INS_IsDirectControlFlow(ins)) // 如果是直接控制流(ins为控制流指令,目标地址由指令指针或立即数指定) { ETYPE type = INS_IsCall(ins) ? ETYPE_CALL : ETYPE_BRANCH; // 判断是否为call指令,是则返回ETYPE_CALL // 静态目标可以在这里进行一次映射 // 参数分别为当前指令地址、当前指令目标地址、下一指令地址、指令类型 COUNTER* pedg = Lookup(EDGE(INS_Address(ins), INS_DirectControlFlowTargetAddress(ins), INS_NextAddress(ins), type)); // 插桩 INS_InsertCall(ins, IPOINT_TAKEN_BRANCH, (AFUNPTR)docount, IARG_ADDRINT, pedg, IARG_END); } else if (INS_IsIndirectControlFlow(ins)) // 如果是间接控制流(ins为控制流指令,且目标地址通过内存或寄存器提供) { ETYPE type = ETYPE_IBRANCH; // 直接指定类型为间接控制流 if (INS_IsRet(ins)) // 是否为ret或iret { type = ETYPE_RETURN; } else if (INS_IsCall(ins)) { type = ETYPE_ICALL; } // 进行插桩 INS_InsertCall(ins, IPOINT_BEFORE, (AFUNPTR)docount2, IARG_INST_PTR, IARG_BRANCH_TARGET_ADDR, IARG_ADDRINT, INS_NextAddress(ins), IARG_UINT32, type, IARG_BRANCH_TAKEN, IARG_END); } else if (INS_IsSyscall(ins)) // 如果是syscall指令 { COUNTER* pedg = Lookup(EDGE(INS_Address(ins), ADDRINT(~0), INS_NextAddress(ins), ETYPE_SYSCALL)); INS_InsertPredicatedCall(ins, IPOINT_BEFORE, (AFUNPTR)docount, IARG_ADDRINT, pedg, IARG_END); }}/* ===================================================================== */inline INT32 AddressHighNibble(ADDRINT addr) { return 0xf & (addr >> (sizeof(ADDRINT) * 8 - 4)); }/* ===================================================================== */static std::ofstream* out = 0;VOID Fini(int n, void* v) // 程序结束时的处理函数{ const INT32 nibble = KnobFilterByHighNibble.Value(); *out << "EDGCOUNT 4.0 0\n"; // profile header, no md5sum UINT32 count = 0; for (EDG_HASH_SET::const_iterator it = EdgeSet.begin(); it != EdgeSet.end(); it++) { const pair< EDGE, COUNTER* > tuple = *it; // skip inter shared lib edges if (nibble >= 0 && nibble != AddressHighNibble(tuple.first._dst) && nibble != AddressHighNibble(tuple.first._src)) { continue; } if (tuple.second->_count == 0) continue; count++; } *out << "EDGs " << count << endl; *out << "# src dst type count next-ins\n"; *out << "DATA:START" << endl; for (EDG_HASH_SET::const_iterator it = EdgeSet.begin(); it != EdgeSet.end(); it++) { const pair< EDGE, COUNTER* > tuple = *it; // skip inter shared lib edges if (nibble >= 0 && nibble != AddressHighNibble(tuple.first._dst) && nibble != AddressHighNibble(tuple.first._src)) { continue; } if (tuple.second->_count == 0) continue; *out << StringFromAddrint(tuple.first._src) << " " << StringFromAddrint(tuple.first._dst) << " " << StringFromEtype(tuple.first._type) << " " << decstr(tuple.second->_count, 12) << " " << StringFromAddrint(tuple.first._next_ins) << endl; } *out << "DATA:END" << endl; *out << "## eof\n"; out->close();}/* ===================================================================== *//* Main *//* ===================================================================== */int main(int argc, char* argv[]){ if (PIN_Init(argc, argv)) // 初始化 { return Usage(); } string filename = KnobOutputFile.Value(); // 输出文件 if (KnobPid) { filename += "." + decstr(getpid()); } out = new std::ofstream(filename.c_str()); INS_AddInstrumentFunction(Instruction, 0); // 注册插桩函数 PIN_AddFiniFunction(Fini, 0); // 注册Fini函数 // 开始执行,不返回 PIN_StartProgram(); return 0;}/* ===================================================================== *//* eof *//* ===================================================================== */ |
7.3 消除控制流
上面新增的docunt()函数的代码十分简洁,极大地提升了性能。除此之外,还可以被Pin内联,进一步避免函数调用的开销。
但是现在的docount()函数中存在控制流,这有可能在进行内联时发生未知的改变。最好的解决办法是去掉函数中的控制流,这样进行内联时可以保证健壮性。
考虑到docount()函数的'taken'参数要么为0,要么为1,所以可以将函数代码修改为如下:
1 | VOID docount( COUNTER *pedg, INT32 taken ){ pedg->_count += taken;} |
如此修改后,docunt()函数就可以进行内联了,并且可以保证函数的健壮性。
7.4 让Pin决定插桩位置
在某些情况下,我们不关心具体在什么位置进行插桩,只要保证插桩代码位于基本块内部即可。在这种情况下,我们可以将插桩位置的选择权交给Pin自身,Pin可以选择需要最少寄存器进行保存和恢复的插入点,提升性能。
一个样例如下:
1 | #include <iostream>#include <fstream>#include "pin.H"using std::cerr;using std::endl;using std::ios;using std::ofstream;using std::string;ofstream OutFile;// 记录运行的指令的数量,设置为静态变量方便编译器优化docount函数static UINT64 icount = 0;// 在每个块之前调用该函数// 对calls使用fast linkageVOID PIN_FAST_ANALYSIS_CALL docount(ADDRINT c) { icount += c; }// Pin在遇到一个新块时调用,插入对docount 函数的调用VOID Trace(TRACE trace, VOID* v){ // 检查trace中的每个基本块 for (BBL bbl = TRACE_BblHead(trace); BBL_Valid(bbl); bbl = BBL_Next(bbl)) { // 对每个bbl插入对docount函数的调用,将指令数量作为参数传递 // IPOINT_ANYWHERE参数允许Pin在bbl内部任意位置插入call以获取最好的性能 // 对call使用fast linkage BBL_InsertCall(bbl, IPOINT_ANYWHERE, AFUNPTR(docount), IARG_FAST_ANALYSIS_CALL, IARG_UINT32, BBL_NumIns(bbl), IARG_END); }}KNOB< string > KnobOutputFile(KNOB_MODE_WRITEONCE, "pintool", "o", "inscount.out", "specify output file name");// 程序退出时调用VOID Fini(INT32 code, VOID* v){ OutFile.setf(ios::showbase); OutFile << "Count " << icount << endl; OutFile.close();}/* ===================================================================== *//* Print Help Message *//* ===================================================================== */INT32 Usage(){ cerr << "This tool counts the number of dynamic instructions executed" << endl; cerr << endl << KNOB_BASE::StringKnobSummary() << endl; return -1;}/* ===================================================================== *//* Main *//* ===================================================================== */int main(int argc, char* argv[]){ // 初始化Pin if (PIN_Init(argc, argv)) return Usage(); OutFile.open(KnobOutputFile.Value().c_str()); // 注册插桩函数Trace TRACE_AddInstrumentFunction(Trace, 0); // 注册Fini函数 PIN_AddFiniFunction(Fini, 0); // 开始执行,不返回 PIN_StartProgram(); return 0;} |
这里IPOINT是一个枚举类型,决定了分析call被插入到什么地方。插入的对象可以是:INS,BBL,TRACE,RTN,其完整可用的值如下:
- IPOINT_BEFORE:在插桩对象的第一条指令之前插入call,总是有效
- IPOINT_AFTER:在插桩对象的最后一条指令的失败路径处插入call
- 如果是routine(RTN),在所有返回路径处插桩
- 如果是instruction(INS),仅在
INS_IsValidForIpointAfter()函数为真的情况下适用 - 如果是BBL,仅在
BBL_HasFallThrough()函数为真的情况下适用 - 如果是TRACE,仅在
TRACE_HasFallThrough()函数为真的情况下适用
- IPOINT_ANYWHERE:在插桩对象的任意位置插入call,不适用
INS_InsertCall()和INS_InsertThenCall()函数 - IPOINT_TAKEN_BRANCH:在插桩对象的控制流的执行边界处插入call,仅适用于
INS_IsValidForIpointTakenBranch()返回真的情况。
7.5 使用Fast Call Linkages
对于一些比较“小”的函数来说,对函数的调用开销有时与函数自身的运算开销基本相同,因此一些编译器会提供一些调用链接优化机制来降低开销。例如,IA-32下的gcc有一个在寄存器中传递参数的regparm属性。
Pin中有一定数量的备用链接,使用PIN_FAST_ANALYSIS_CALL来声明分析函数即可使用,而插桩函数InsertCall则需要使用IARG_FAST_ANALYSIS_CALL。如果二者只更改了一个,那么就可能出现传参错误。例如前面给出的源码例子就使用了fast call linkages:
1 | ... ...// 对分析函数使用fast linkageVOID PIN_FAST_ANALYSIS_CALL docount(ADDRINT c) { icount += c; }VOID Trace(TRACE trace, VOID* v){ // 检查trace中的每个基本块 for (BBL bbl = TRACE_BblHead(trace); BBL_Valid(bbl); bbl = BBL_Next(bbl)) { // 对插桩函数使用fast linkage BBL_InsertCall(bbl, IPOINT_ANYWHERE, AFUNPTR(docount), IARG_FAST_ANALYSIS_CALL, IARG_UINT32, BBL_NumIns(bbl), IARG_END); }}... ... |
在对比较复杂的大型函数使用该方法时,效果并不明显,但不会造成性能的下降。
第二个调用链接优化是消除帧指针。如果使用gcc,则推荐加上"-fomit-frame-pointer"选项。Pin官方的标准Pintool的makefile包括该选项。与PIN_FAST_ANALYSIS_CALL一样,该选项对“小”函数的效果比较明显。需要注意的是,debugger会根据帧指针来显示堆栈回溯情况,所以如果想调试Pintool的话,就不要设置该选项。如果使用标准的Pintool的makefile来进行变异,则可以通过修改OPT选项来进行改变:
1 | make OPT=-O0 |
7.6 重写有条件的分析例程实现Pin内联
Pin通过自动内联没有控制流变化的分析routine来提升插桩性能。但是有很多分析routine是有控制流的,最典型的就是有一个简单的“if-then”的条件语句,它只会执行少量的分析代码,并“then”部分只执行一次。为了将这类的语句转换为常规的没有控制流变化的语句,Pin提供了一些插桩API来重写分析routine。下面是一个重写的例子:
例如我们当前想要实现的一个分析routine的代码如下:
1 | // IP-sampling分析routine实现:VOID IpSample(VOID *ip){ --icount; if (icount == 0) { fprintf(trace, "%p\n", ip); icount = N + rand() % M; }} |
在原始的IpSample()函数中有一个明显的条件语句,会存在控制流的变化。如何消除该条件控制流的存在呢?
可以看到分析routine内部其实可以拆解为2部分功能:icount的自减和“if”语句,那么可以使用两个单独的函数实现。而且,前者比后者的执行频率要更高。拆解后的代码如下:
1 | /* * IP-sampling分析routine实现: * * VOID IpSample(VOID *ip) * { * --icount; * if (icount == 0) * { * fprintf(trace, "%p\n", ip); * icount = N + rand() % M; * } * } */// 计算icountADDRINT CountDown(){ --icount; return (icount == 0);}// 打印当前指令的IP并且icount被重置为N和N+M中的一个随机数VOID PrintIp(VOID* ip){ fprintf(trace, "%p\n", ip); // 准备下次计算 icount = N + rand() % M;} |
一个完整的实现消除控制流变化的代码如下:
1 | /* source/tools/ManualExamples/isampling.cpp */#include <stdio.h>#include <stdlib.h>#include "pin.H"FILE* trace;const INT32 N = 100000;const INT32 M = 50000;INT32 icount = N;/* * IP-sampling分析routine实现: * * VOID IpSample(VOID *ip) * { * --icount; * if (icount == 0) * { * fprintf(trace, "%p\n", ip); * icount = N + rand() % M; * } * } */// 计算icountADDRINT CountDown(){ --icount; return (icount == 0);}// 打印当前指令的IP并且icount被重置为N和N+M中的一个随机数VOID PrintIp(VOID* ip){ fprintf(trace, "%p\n", ip); // 准备下次计算 icount = N + rand() % M;}VOID Instruction(INS ins, VOID* v){ // 每条指令执行后都会调用CountDown() INS_InsertIfCall(ins, IPOINT_BEFORE, (AFUNPTR)CountDown, IARG_END); // 只有当CountDown返回非0值时才会调用PrintIp() INS_InsertThenCall(ins, IPOINT_BEFORE, (AFUNPTR)PrintIp, IARG_INST_PTR, IARG_END);}VOID Fini(INT32 code, VOID* v){ fprintf(trace, "#eof\n"); fclose(trace);}/* ===================================================================== *//* Print Help Message *//* ===================================================================== */INT32 Usage(){ PIN_ERROR("This Pintool samples the IPs of instruction executed\n" + KNOB_BASE::StringKnobSummary() + "\n"); return -1;}/* ===================================================================== *//* Main *//* ===================================================================== */int main(int argc, char* argv[]){ trace = fopen("isampling.out", "w"); if (PIN_Init(argc, argv)) return Usage(); INS_AddInstrumentFunction(Instruction, 0); PIN_StartProgram(); return 0;} |
使用条件插桩API INS_InsertIfCall()和INS_InsertThenCall()来告诉Pin只有当CountDown()执行结果非0时,才执行PrintIp()。这样一来,CountDown()函数就可以内联在Pin中,对于没有内联的PrintIp()则只有在满足条件时才会执行一次。
INS_InsertThenCall()插进去的函数只有在INS_InsertIfCall()插进去的函数返回非0值时才会执行。这个功能可以说是一个十分巧妙的功能。
8. 构建自己的Pintool
在开发自己的Pintool时,可以copy一份example目录, 然后在makefile.rules文件中添加上自己的tool,可以以最简单的MyPinTool为模版。
8.1 在套件目录树内进行构建
如果直接修改MyPinTool,并且没有特殊的编译需求,则直接使用默认配置就好。如果要新增tool或者需要指定特殊的构建标志,则需要修改makeifile.rules文件。
构建YourTool.so(源文件为YourTool.cpp):
1 | make obj-intel64/YourTool.so |
如果想编译成IA-32架构,则使用“obj-ia32”替换“obj-intel64”即可。
8.2 在套件目录树外构建
copy文件夹MyPinTool到指定位置子,然后编辑makefile.rules文件。
1 | make PIN_ROOT=<path to Pin kit> obj-intel64/YourTool.so |
要更改将创建工具的目录,可以从命令行覆盖 OBJDIR 变量:
1 | make PIN_ROOT=<path to Pin kit> OBJDIR=<path to output dir> <path to output dir>/YourTool.so |
9. Pin的makefile
9.1 配置目录
目录source/tools/Config中存放了make配置的基本文件,不要轻易修改这些文件,可以基于其中的模版文件进行更新。

下面对其中的几个关键文件进行说明:
- makefile.config:在include链中第一个应该include的文件。它保存了用户可用的所有相关标识和变量的文档,此外还包括特定于OS的配置文件。
- unix.vars:该文件包含makefile使用的一些架构变量和实用程序的Unix定义。
- makefile.default.rules:该文件包含默认的make目标、测试用例和构建规则。
9.2 测试目录
source/tools目录下的每个测试性质的目录中都包含makefile链中的两个文件:
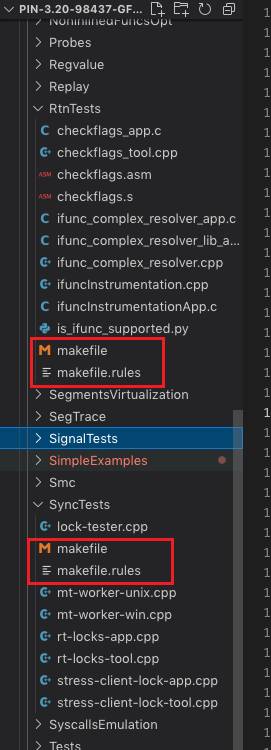
- makefile:运行make时调用,不要修改。其中保存了makefile链的所有相关配置文件的包含指令,属于通用文件,在所有的测试目录中都是相同的。
- makefile.rules:目录特定文件,不同测试目录,文件内容不同。它保存了当前目录的逻辑,应该在目录中构建和运行的所有工具、应用程序和测试等都在该文件中进行定义。
9.3 向makefile中添加测试、工具和应用
下面介绍如何通过makefile构建二进制程序并运行测试。以下描述的变量都在makefile.rules文件的"Test targets"部分进行描述:
- TOOL_ROOTS:定义工具名称,不带文件扩展名,具体的文件扩展名将由make自动添加,例如YourTools.so;
- APP_ROOTS:定义应用程序,不带文件扩展名,具体的文件扩展名将由make自动添加,例如YourApp.exe;
- TEST_ROOTS:定义测试,不要加.test后缀,make会自动添加,例如YourTest.test。
9.4 定义构建规则
默认使用的构建规则是source/tools/Config/makefile.default.rules,输入为单一的c/cpp文件,生成相同名字的二进制程序。如果输入为多个源文件,且需要自定义构建规则,可以在make.rules文件的"Build rules"部分的末尾添加。如下是规则例子:
构建单一源文件且不进行优化:
1 | # Build the intermediate object file.$(OBJDIR)YourTool$(OBJ_SUFFIX): YourTool.cpp $(CXX) $(TOOL_CXXFLAGS_NOOPT) $(COMP_OBJ)$@ $<# Build the tool as a dll (shared object).$(OBJDIR)YourTool$(PINTOOL_SUFFIX): $(OBJDIR)YourTool$(OBJ_SUFFIX) $(LINKER) $(TOOL_LDFLAGS_NOOPT) $(LINK_EXE)$@ $< $(TOOL_LPATHS) $(TOOL_LIBS) |
构建多源文件且进行优化:
1 | # Build the intermediate object file.$(OBJDIR)Source1$(OBJ_SUFFIX): Source1.cpp $(CXX) $(TOOL_CXXFLAGS) $(COMP_OBJ)$@ $<# Build the intermediate object file.$(OBJDIR)Source2$(OBJ_SUFFIX): Source2.c Source2.h $(CC) $(TOOL_CXXFLAGS) $(COMP_OBJ)$@ $<# Build the tool as a dll (shared object).$(OBJDIR)YourTool$(PINTOOL_SUFFIX): $(OBJDIR)Source1$(OBJ_SUFFIX) $(OBJDIR)Source2$(OBJ_SUFFIX) Source2.h $(LINKER) $(TOOL_LDFLAGS_NOOPT) $(LINK_EXE)$@ $(^:%.h=) $(TOOL_LPATHS) $(TOOL_LIBS) |
9.5 在makefile.rules定义测试片段
在"Test recipes"部分自定义自己的测试需求,例如:
1 | YourTest.test: $(OBJDIR)YourTool$(PINTOOL_SUFFIX) $(OBJDIR)YourApp$(EXE_SUFFIX) $(PIN) -t $< -- $(OBJDIR)YourApp$(EXE_SUFFIX) |
9.6 变量和标志
摘取makefile.config中几个重点的标志进行说明:
IN_ROOT:在套件外构建工具时指定Pin套件的位置。
CC: 指定工具的默认c编译器。
CXX:指定工具的默认c++编译器。
APP_CC:指定应用程序的默认 c 编译器。如果未定义,APP_CC 将与 CC 相同。
APP_CXX:指定应用程序的默认 c++ 编译器。如果未定义,APP_CXX 将与 CXX 相同。
TARGET:指定默认目标架构,例如交叉编译。
ICC: 使用英特尔编译器构建工具时指定 ICC=1。
DEBUG: 当指定 DEBUG=1 时,在构建工具和应用程序时会生成调试信息。此外,不会执行任何编译和/或链接优化。